Monitoring
This page has been automatically translated and has not been reviewed in detail yet. Therefore, the translation might not be completely accurate.
The monitoring module is one of the central elements in a NeuroomNet installation. One look is enough to see whether everything is running smoothly. If this is not the case, you can also intervene from here and start or restart systems. In addition to the real-time display of system states and the location of systems, “offline” data can also be stored for maintenance purposes to ensure smooth operation.
From a technical point of view, monitoring monitors the individual components: components report to the NeuroomNet server with the appropriate status or do not report and are displayed as offline.
For the sake of clarity, not all components are displayed on the left side of the monitoring, but only the groups that inherit the corresponding status of the child components.
The tabs at the top of the website offer the following functionality:
- Map: Display of map views / building plans in which groups are located
- Info: Display information about the currently selected group and provide 'offline data'
- Hierarchy: Display of the currently selected group in the hierarchy view including the components and possibly subgroups it contains
- Logs: Displays the log entries for the currently selected group
- Actions: Display and select available actions for the selected group
The left side is used to select groups and is the same for all tabs in this module:
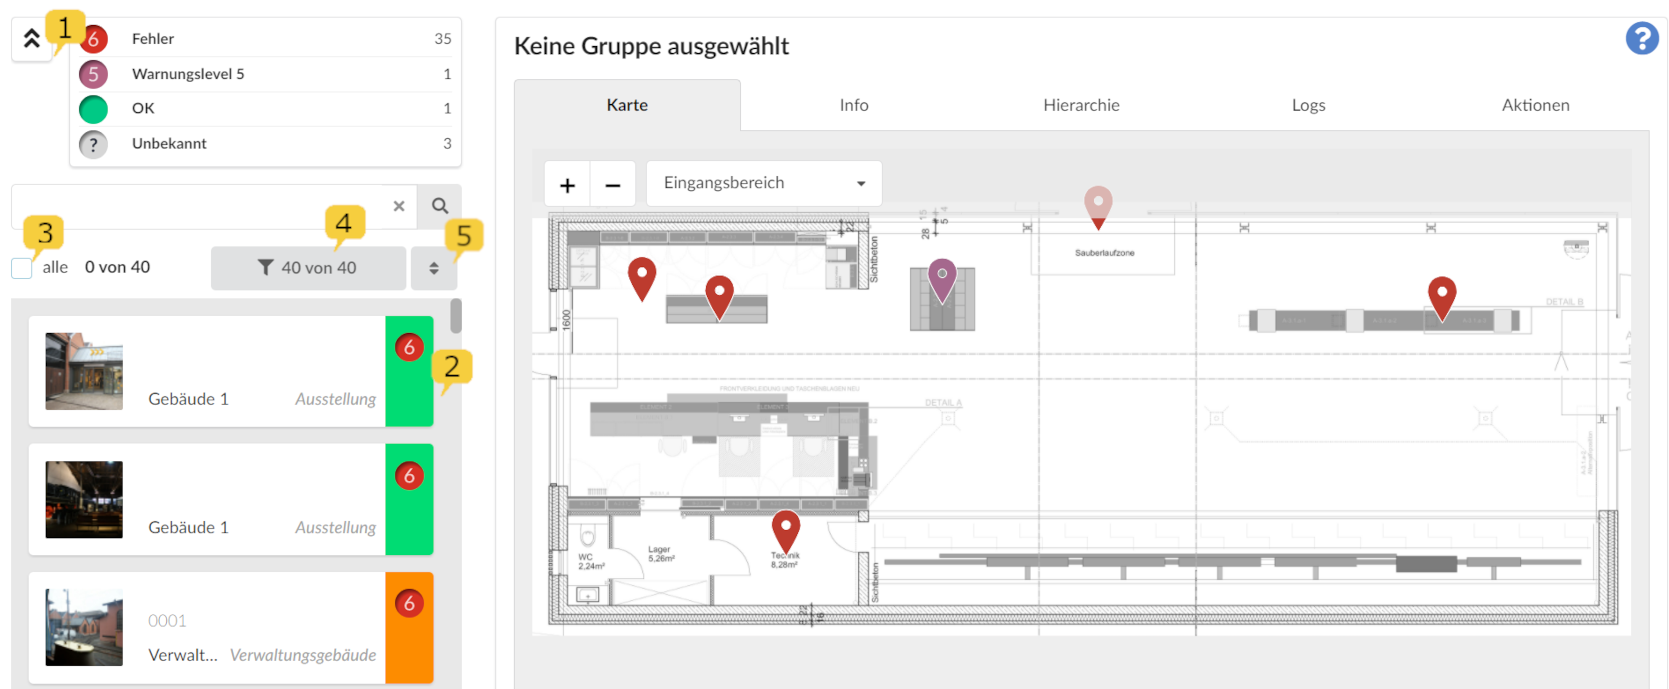
All groups are displayed in 2 (default setting for groups):
Note! In the 'Setup' module you can also set certain groups so that they do not appear in the group list in monitoring.

If a component does not correspond to its target state, a corresponding status is displayed. In the Setup module, you can determine how critical the condition is classified using individually adjustable warning levels (see maintaining warning levels in the Setup module). For example, the failure of a network switch can be assigned a higher priority than the failure of a printer.
With the double arrow up 1 you can display the warning levels and filter them by clicking on them.
When collapsed, it shows how many groups have the highest warning level. In the best case, the green dot (warning level 0) is displayed here followed by the total number of all groups. If one of the groups changes to a higher warning level, this will be displayed at the top.
With the tick "all" 3 the filtered groups can be selected at the same time, for example to see all log entries of these groups in the log view or to carry out an action on these groups at the same time in the Actions tab to send.
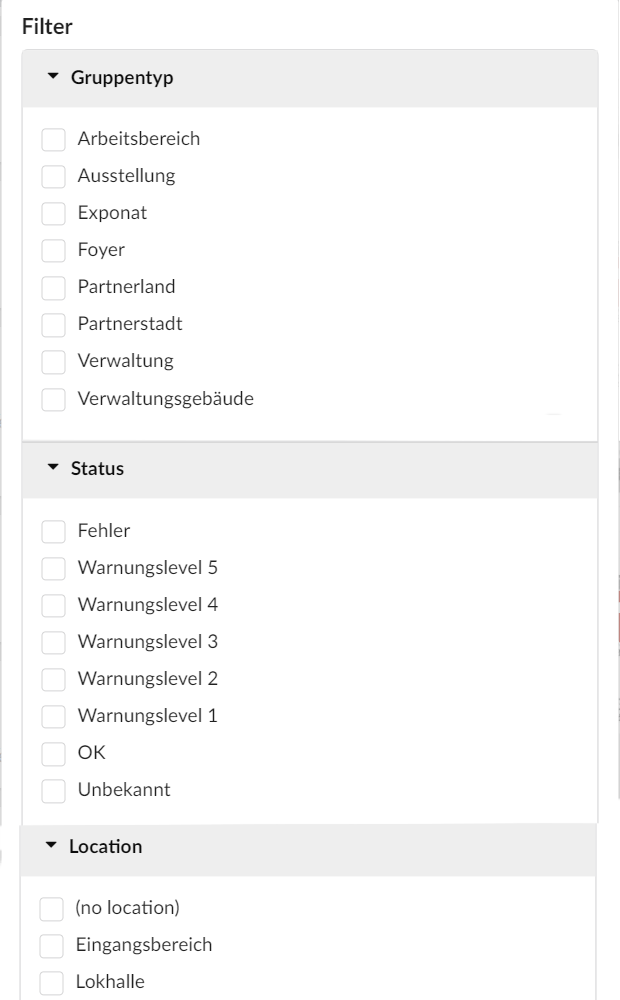
4 shows further filter options according to group type, status and location:

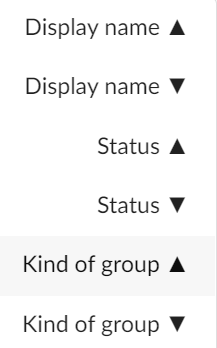
With 5 the group list can be sorted ascending or descending by name, status or group type:
