Tab Status View
Graphical Interface
Overview
The graphical interface of the Status View tab is structured as follows:
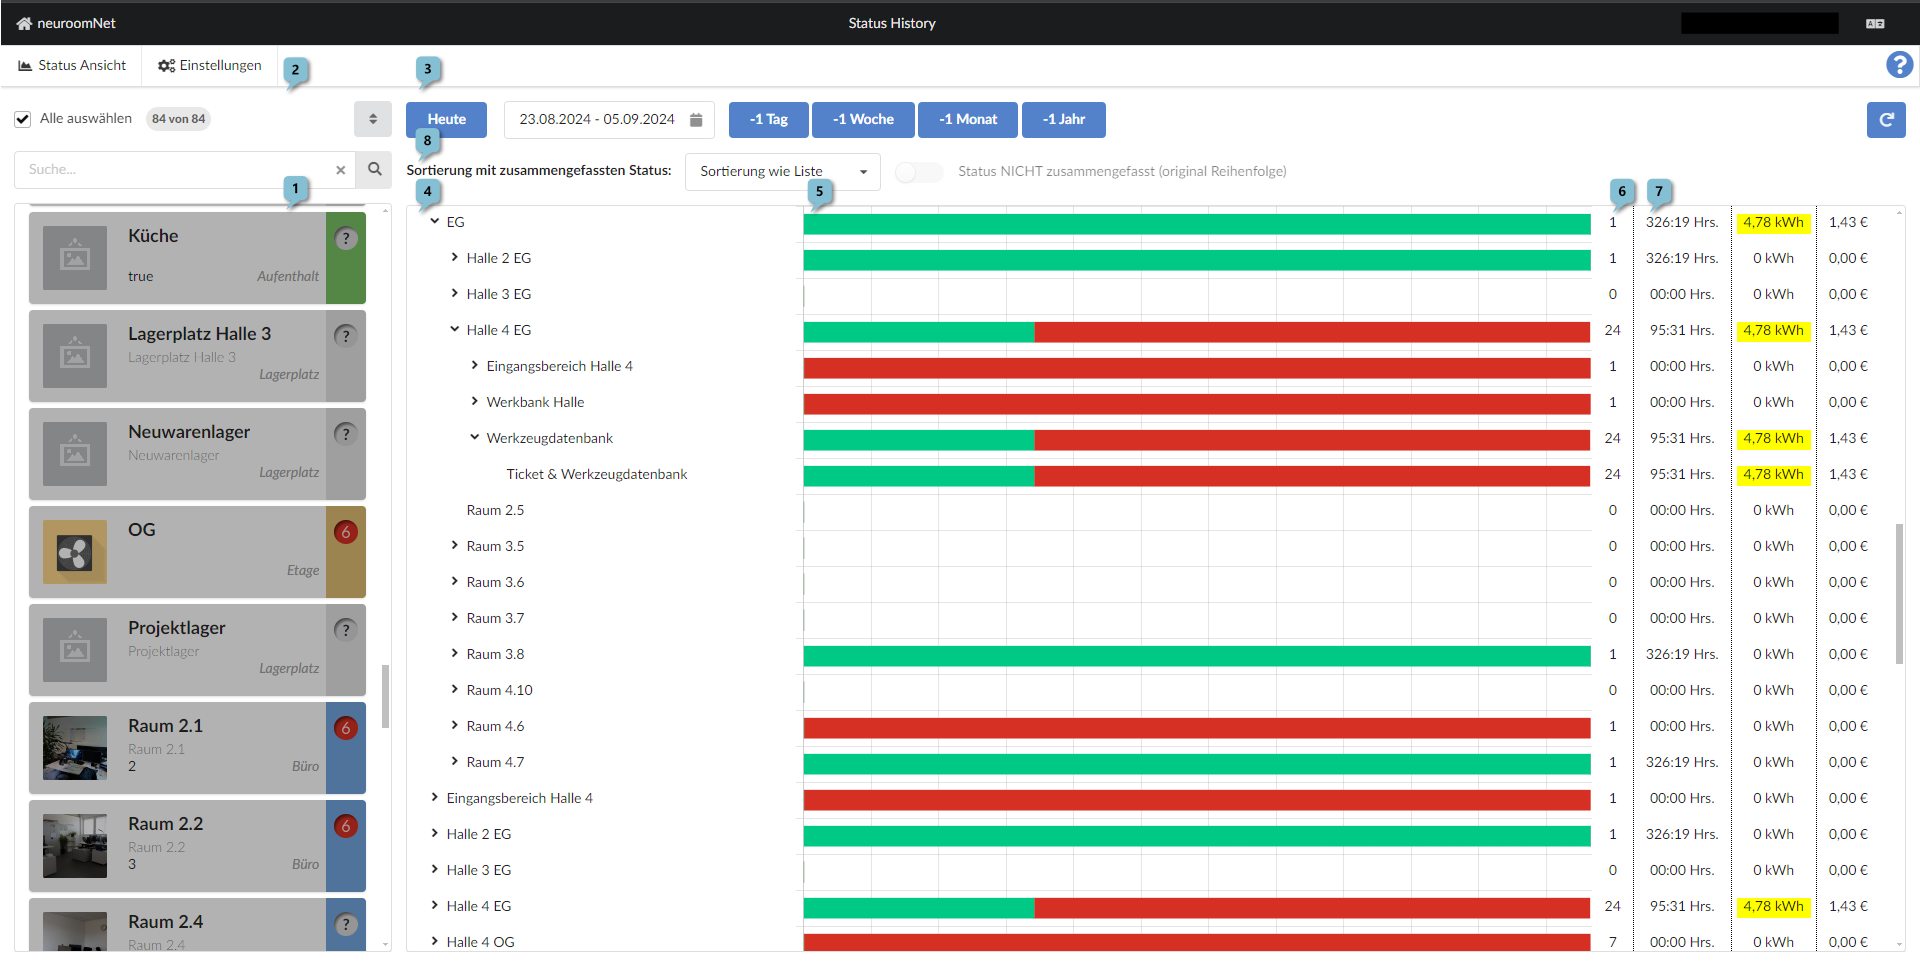
On the left side 1 there is a list of all groups, similar to the Monitoring module. Individual groups can be selected, and multiple groups can be selected using the left mouse button while holding the CTRL key. The currently selected groups are displayed in the middle to right part of the page.
Slightly above 2 there are filtering options. In contrast to the Monitoring module, there is also a "Select all" button to select all groups (this is the case in the screenshot).
In the upper middle part of the page 3 a time period can be selected using the following controls:
- Button "Today": Selects today as the time period (today 00:00 to today's current time)
- Date input field: Two dates can be selected here via two consecutive mouse clicks. The time period between the clicked dates is then selected accordingly
- Buttons "-1 Day", "-1 Week", "-1 Month", "-1 Year": Clicking the buttons shifts the beginning of the selected time period by 1 day, 1 week, 1 month, or 1 year respectively.
Depending on the selected groups and the time period, the status history is visualised in the largest part of the page - the main display area - as follows:
- On the left 4 there is a hierarchical list of the selected groups down to components. Groups can be expanded accordingly: For example, the group "EG" contains the subgroup "Halle 4 EG". "Halle 4 EG" contains, among others, the subgroup "Werkzeugdatenbank" and the group "Werkzeugdatenbank" contains in this case a component "Ticket & Werkzeugdatenbank" (in this case it is a PC client; that it is a PC client is not recognisable here, but can be found out e.g. via the search in the Setup module, see the screenshot at the very bottom of this page)
- Further to the right 5 the status changes of the groups / components / rows on the left are visualised for the specified time period using bars (green visualises ONLINE, red OFFLINE). This visualisation depends on the checkbox "Status NOT summarised (original order)" - more on this later.
- The numbers at 6 indicate how many status changes have been logged for the respective row
- In the 3 columns starting at 7 the following are shown:
- The number of hours (Hrs.) in all statuses except OFFLINE status,
- The consumed kilowatt hours (kWh)
- The electricity cost in euros
Checkbox "Status NOT summarised (original order)"
The display in the main display area can be further adjusted using the options at 8:
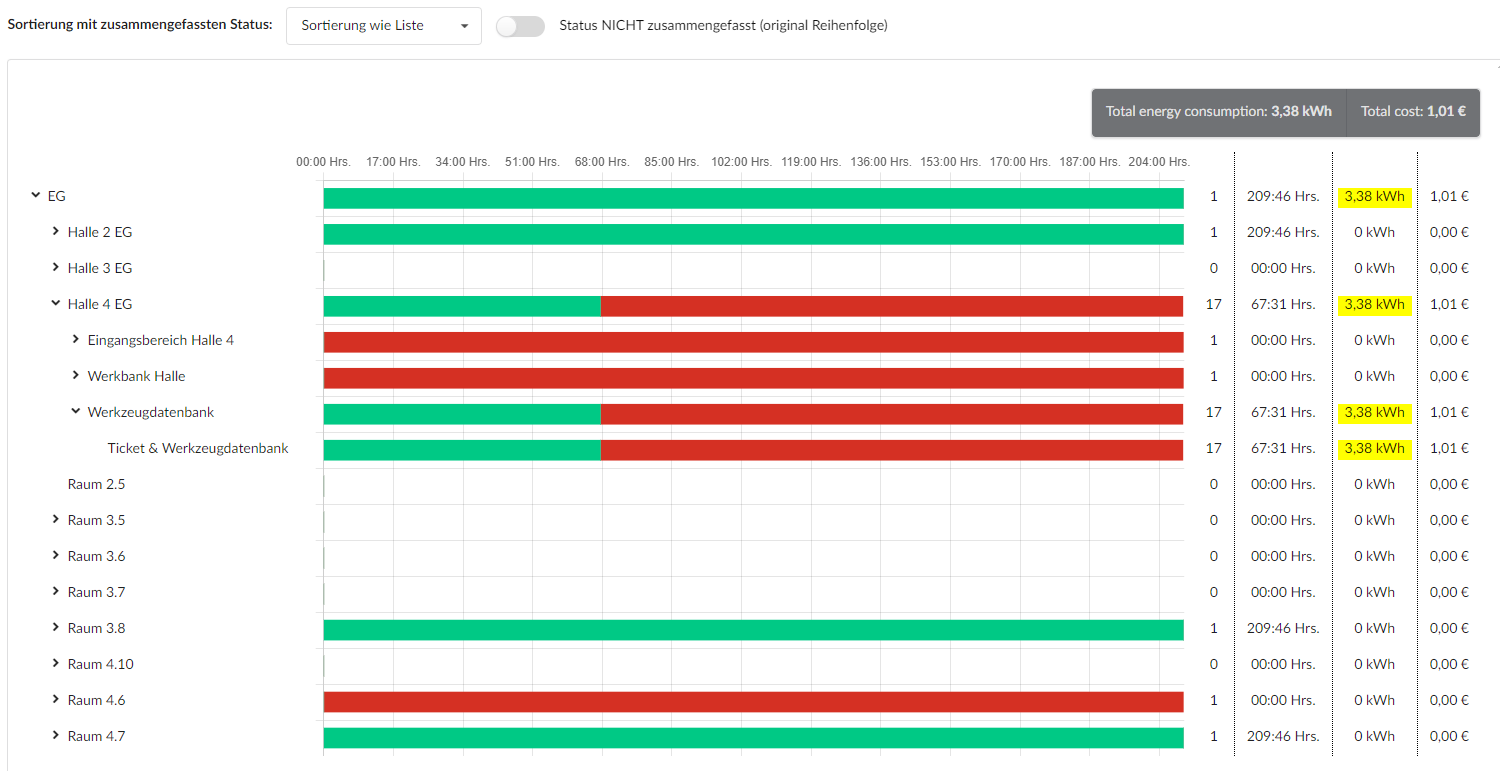
- Checkbox "Status NOT summarised (original order)": This checkbox can only be selected / checked if a single group is selected1. If this checkbox is checked (the default is unchecked), the bars in the main display area show the actual time periods during which components / groups were ONLINE / OFFLINE (or had other statuses). Otherwise, the bars visually show the percentage of time that components / groups were ONLINE / OFFLINE (or had other statuses)
- Combobox "Sorting with summarised status": If the previously mentioned checkbox is not activated, the sorting of the rows, especially bars, can be changed here
For a simpler explanation of the checkbox "Status NOT summarised (original order)", here are two screenshots:
Screenshot with checkbox not activated
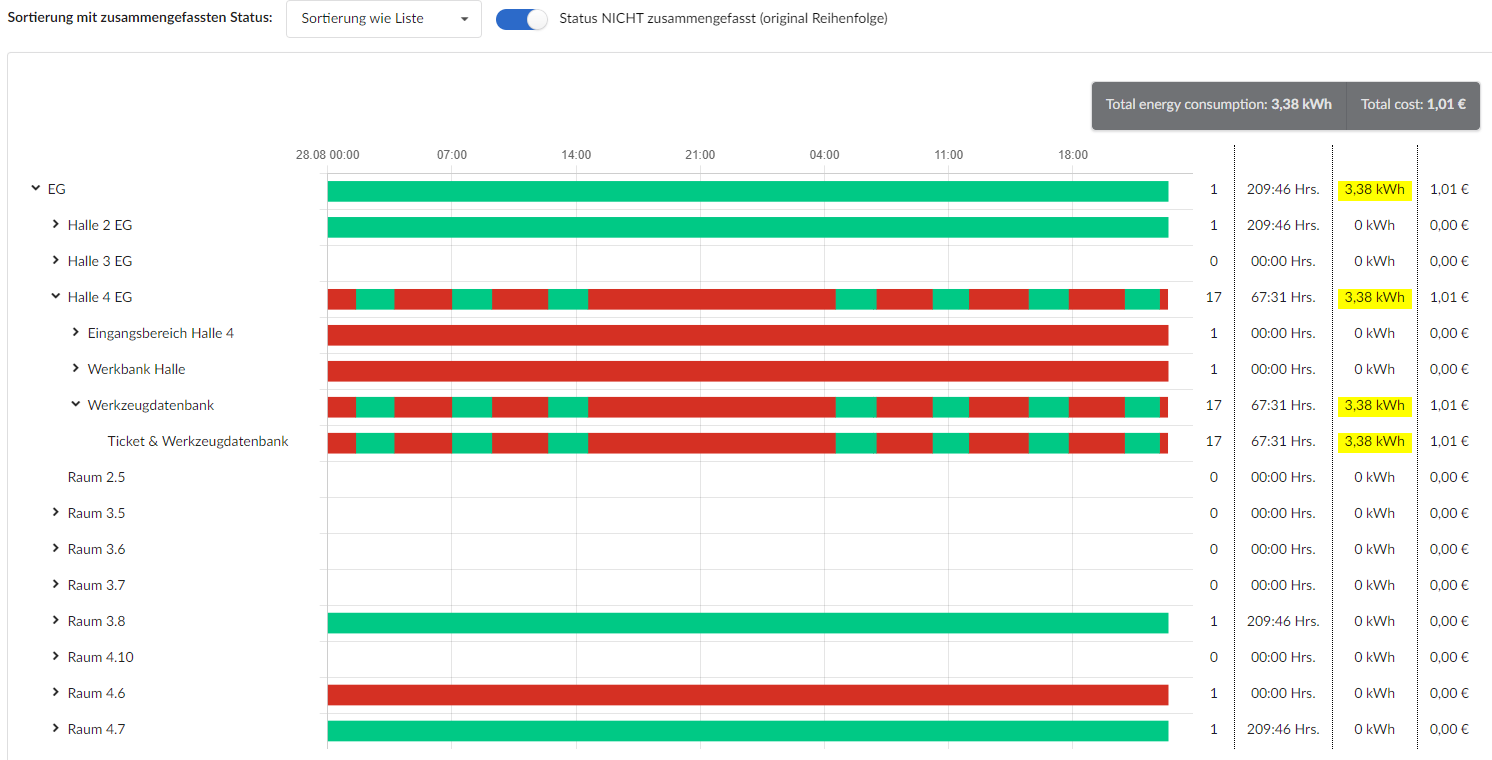
Screenshot with checkbox activated
Besides the change of bars, the scale also changes here and concrete date and time information is displayed2
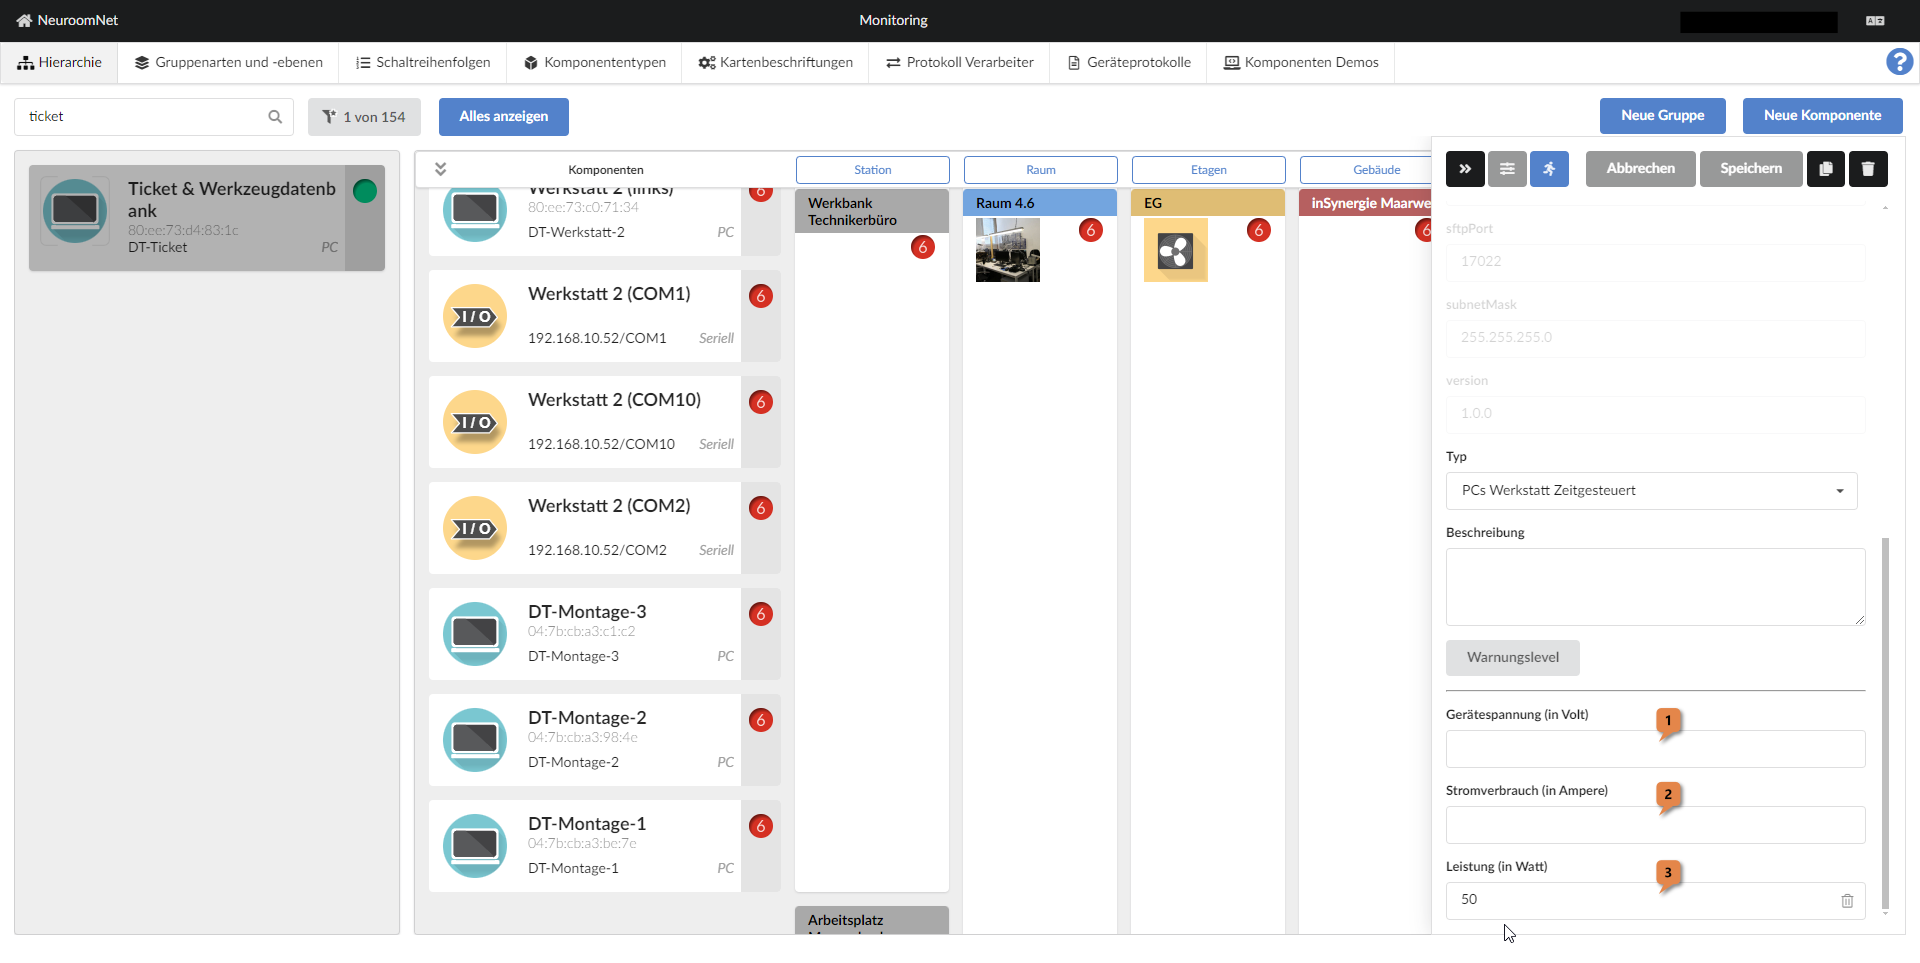
Calculation of Kilowatt Hours and Electricity Costs
The kilowatt hours (kWh) and electricity costs 7 are calculated
- from the number of operating hours 7
- from the power (Watt) 3 or alternatively device voltage (Volt) 1 multiplied by power consumption (Ampere) 2 of the respective components3, see the following screenshot
- And the electricity price and currency from the Settings tab