Traffic Inspector
This page has been automatically translated and has not been reviewed in detail yet. Therefore, the translation might not be completely accurate.
Logs in real time
The Traffic Inspector is a tool for debugging automated processes in the system:

After opening the Traffic Inspector from the NeuroomNet homepage, corresponding logging is activated for the Traffic Inspector as long as it is running and not paused. As soon as the Traffic Inspector window is closed (or there is no open window with the Traffic Inspector), corresponding logging is deactivated and the previous logs are deleted.
Overview
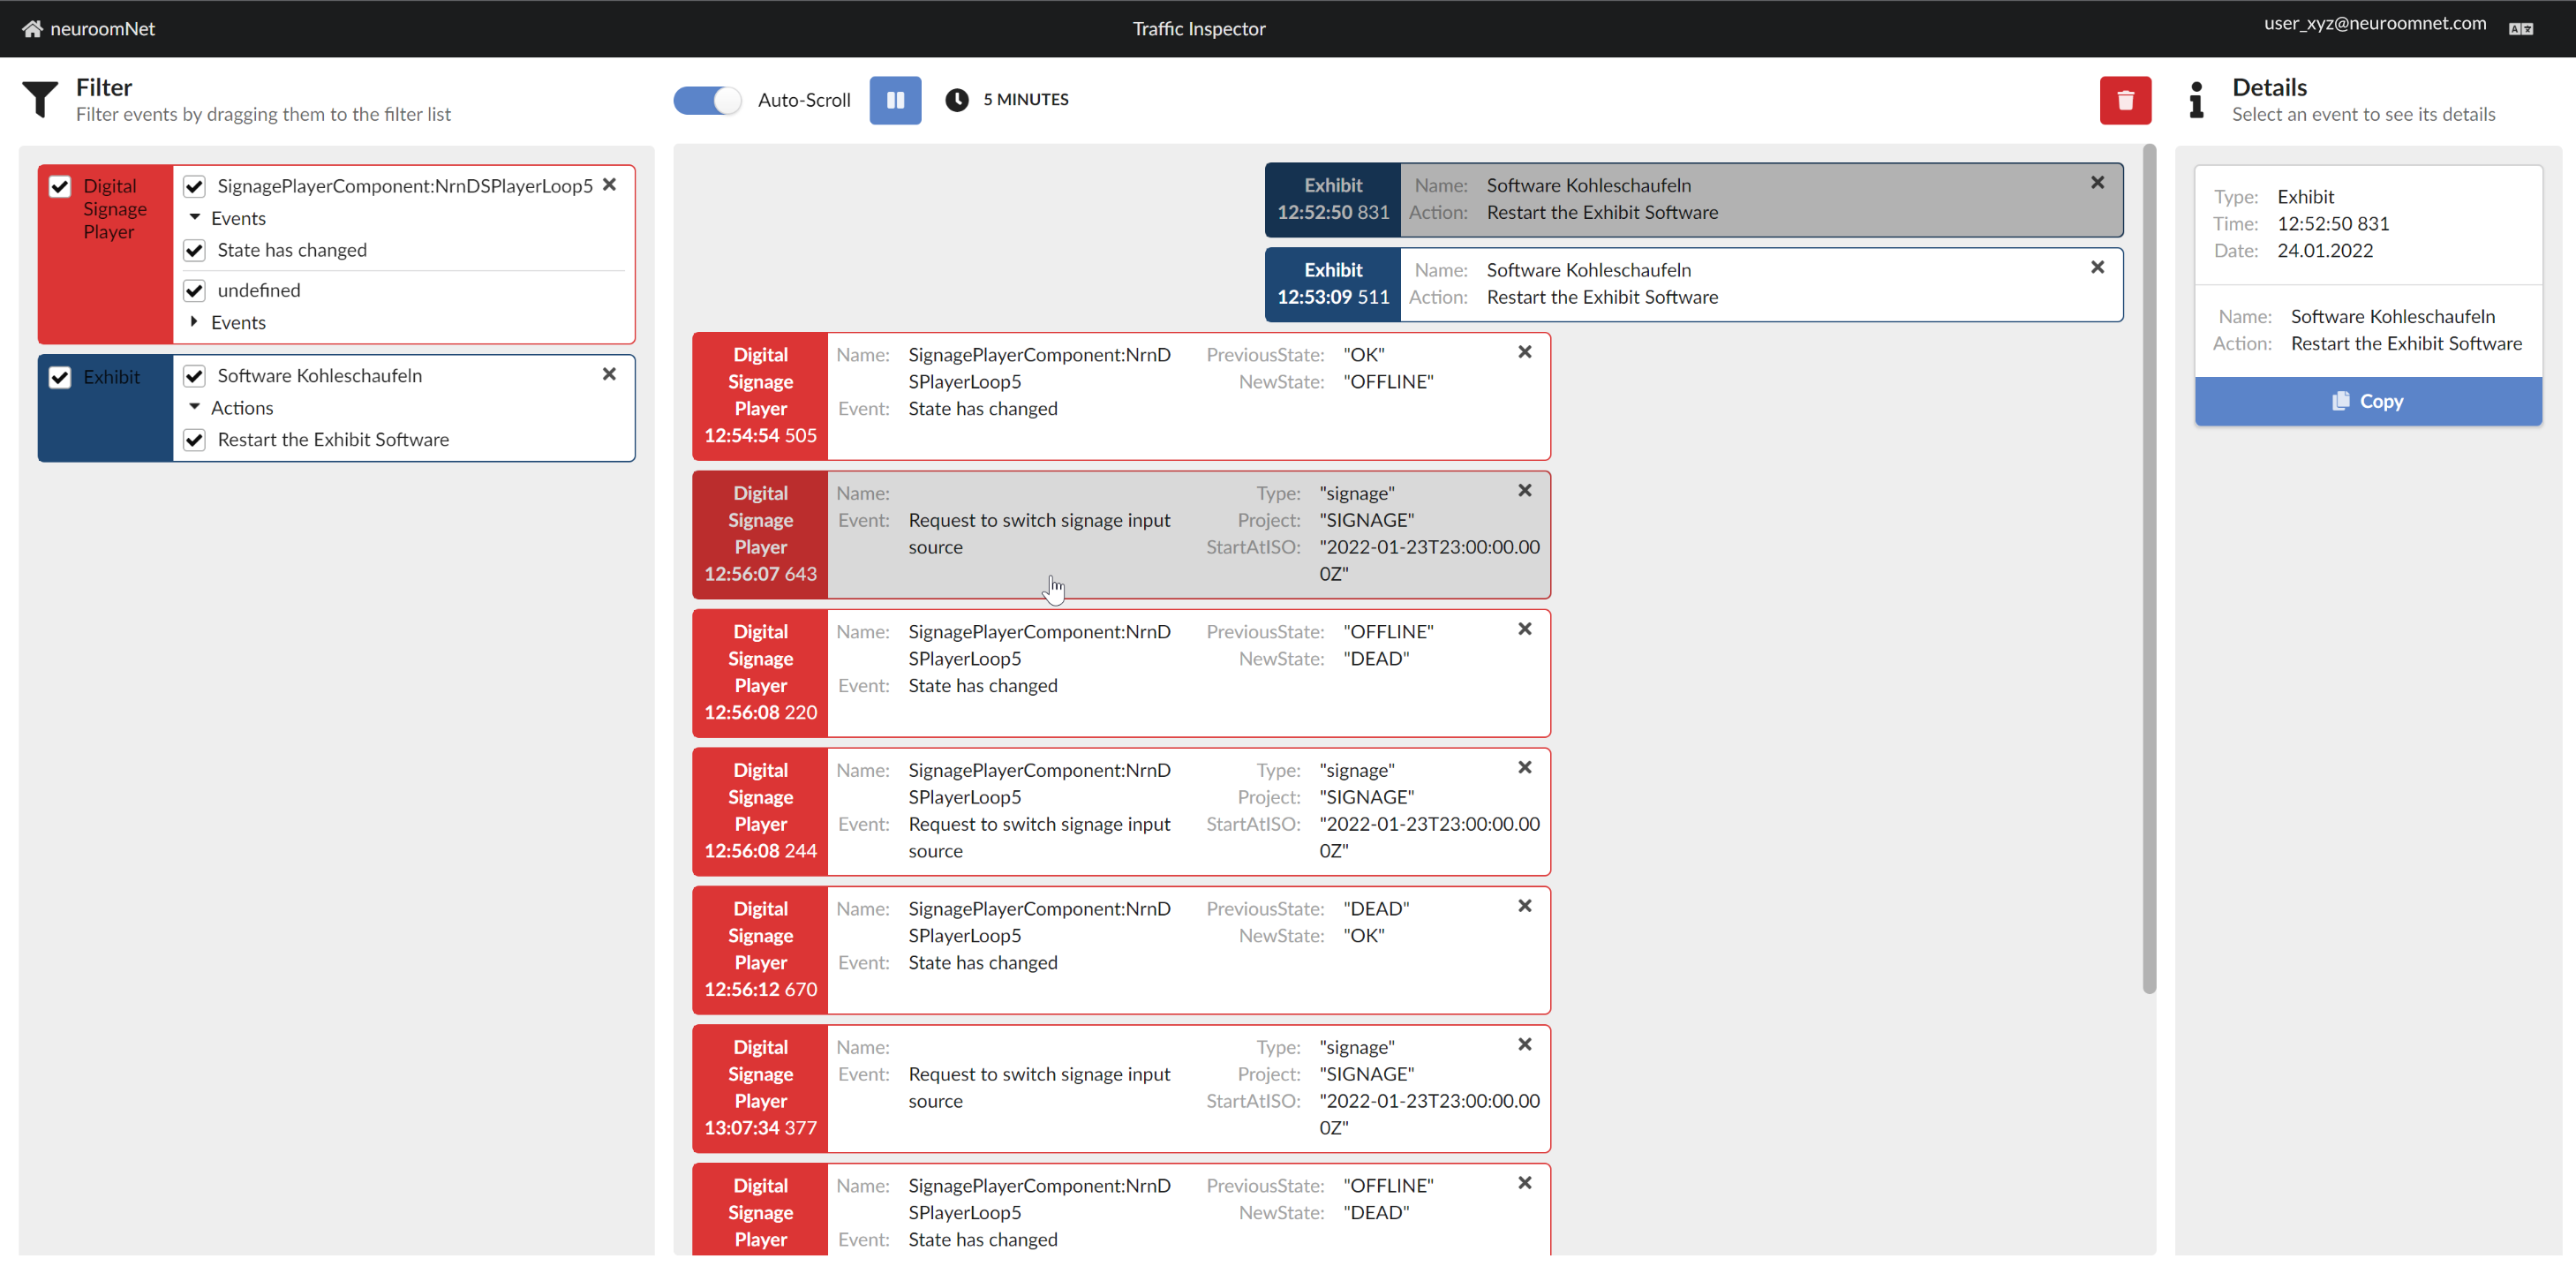
The Traffic Inspector displays logs written in real time and visually distinguishes between so-called events (from English: events) and actions (actions) as follows:
- Logging entries triggered by events are displayed left-aligned
- Logging entries triggered by actions are displayed right-aligned
- The start and end of the execution of scripts in the script blocks are displayed across the entire width
In the NeuroomNet context, by events (see Events as triggers) we mean the following:
- Messages / signals from components to the NeuroomNet server (such as a motion detector reports movement),
- Changes to global variables defined in NeuroomNet modules
- Dashboard events (pressing a button, moving a slider)
- Custom events (to trigger a script block from the time control or the dashboard)
Actions in the NeuroomNet context are operations in components initiated by NeuroomNet or in NeuroomNet and can be triggered in several places in NeuroomNet, such as: b.
- in the media control in the actions column
- in the time control
- In monitoring group or component actions
- In the setup indirectly via switching sequences
- in dashboards via appropriate built-in functionalities
Below are a few examples of actions from specific components:
- PC client components: Reboot, Hide Desktop, Show Taskbar
- Exhibits: Reboot the computer, Restart the exhibit software
- RFID: Switch all LEDs off
- Digital Signage Player: Activate playlist
- PJLink: Choose input, Power on, Power off
- KNX: Send data to actor
- All components: Enforce Warning level, Reset warning level
Automatic pause
The Traffic Inspector automatically pauses after 5 minutes or can be paused manually for a better overview. The automatic pause occurs because in extreme cases in the past browser crashes occurred due to the display of a large amount of log data in the web browser.
The following functions and options are available in the UI:
- Filter: On the left side you can filter for specific triggers or actions using drag and drop
- Pause: Logging can be paused for a better overview when there is a high volume of log entries
- Auto-scroll: The automatic scrolling to new log entries can be deactivated here
- “5 minutes”: The automatic pause after 5 minutes can be deactivated here
- Export functionality: The log entries visible on the screen can be exported as Json or PDF files
- Trashcan: The log entries visible on the screen will be deleted
- On the right side of the screen you can see detailed information about the log entry you have just selected
Filters
During operation, there may be some components or events that produce a lot of entries and make the log confusing. The filters help here.
You can drag and drop one of the disturbing entries from the middle area to the left into the filter area.
If you drag different actions/events of a component type into the filter area, they will be automatically grouped.
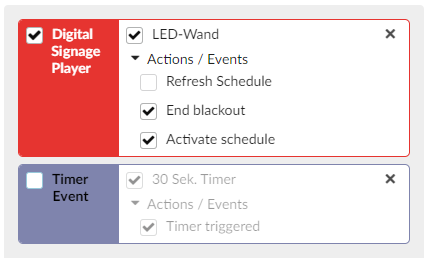
Then remove the check mark from the checkbox and all entries from this family will be hidden from the log.

Explanation for example in the picture:
Of components of the type "Digital Signage Player", only the "Refresh Schedule" actions of the "LED Wall" component are hidden. All other actions continue to appear in the log.
However, all timer events, including all timers and their actions and events, are hidden.
History mode
In the right column, the Traffic Inspector can be switched to history mode using the “Show past events” switch.
In this mode you can no longer see the current movements in traffic, but you can go back in time.
How far back in time the traffic extends depends on how much memory is made available for it on the respective system.

Configure time period
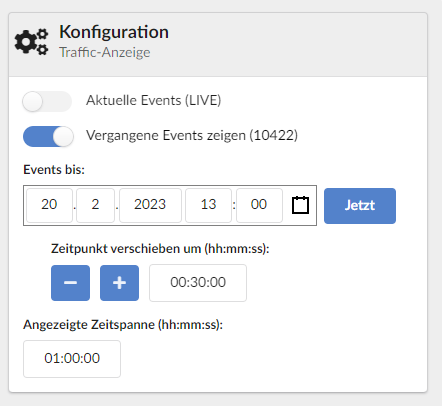
You select a point in time with a date and time to view the events that took place before. You can use the “Displayed time span” field to set how far back from the point in time you want to look.
In the example of the screenshot, the events would now be displayed within an hour, namely between 12:00 and 1:00 p.m. 10,422 log entries were registered within this hour.
If you now want to jump forward or back in time, you can easily do so using the “Move time by” function.
In the example shown, if you click on the minus button, the time would be moved back 30 minutes to 12:30 (thus the time period 11:30 to 12:30 is displayed). When you click on the plus button, the time shifts to 1:30 p.m. and goes back to 12:30 p.m. By clicking on the “Now” button, the starting time is shifted to the current time.